
Novel coronavirus(COVID-19) originated from a coronavirus associated with severe acute respiratory syndrome (SARS) and the common cold. The combination of big data and predictive analytics, along with artificial intelligence and various heat sensors, promises to effectively control the spread of the epidemic and thus minimize the number of deaths.
The limited energy available to detect the virus often makes it impossible to determine the number of infected cases, leaving the true danger of the virus in doubt. Data analysis techniques are a decisive contribution to supporting epidemiologists.
Data analysis, like mathematics, plays a fundamental role. As in the past few years, the pioneers of data science have had a profound impact on the world, using data and analysis to drive significant change and progress as diseases spread.
Historically, one of the earliest USES of data analysis was the 1854 Broad Street cholera outbreak in London. John Snow, one of the first data-driven epidemiologists, conducted a geospatial analysis of the deaths in London to isolate the source of the disease. According to John Snow's analysis, the British authorities will be able to take precise precautions against the spread of the epidemic.
How to evaluate the data?
The implementation of models through the data analysis system has demonstrated the ability to assess trends in general. For example, the most common "attractive-infection-recovery" method is to recover from infection. SIR) model, an epidemiological model used to calculate "the theoretical number of cases of infection that increases over time in a confined space with infective cases". The model used coupled equations to analyze the number of susceptible persons S(t), the number of infected persons I(t), and the number of recovered persons R(t). One of the simplest SIR models is the kermg-mckendrick model. This epidemic model is considered the basis for many other similar analytical models. Among them, I found Ettore Mariotti's analysis the most interesting.
The first is an island, a system in which people have no free access. At a given time, each person may be in one of the following states: susceptible, infected, and convalescent, because people who have never had the disease (S) are likely to become ill and become infected at a certain time (I) and then recover (R). Covid-19 is more suitable for adding a "Exposed" state to the SIR model, which includes persons with the virus but not yet diagnosed as infected (asymptomatic carriers) -- SEIR model.
SEIR model
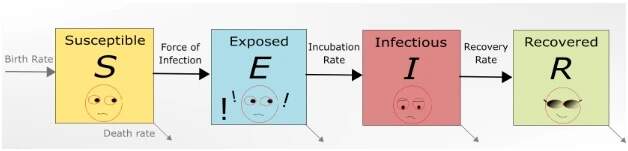
Figure 1: SEIR model (source: triplebyte.com)
The SEIR model takes into account two factors: the dynamics of the virus and the interactions between individuals. The latter is extremely complex and requires the use of data analysis techniques. Through these models and techniques, we can define the R0 parameter to represent the number of people who are likely to be infected by each infected person.
For example, suppose that someone A is sick, and R0 = 2 in the system, that means A is going to infect two people. These 2 people infect 4 people, and these 4 people will infect 2 people (so 4 x 2 = 8), and so on. This highlights the rapid spread of disease by multiplication rather than accumulation. R0 can occur in three basic cases as shown in figure 2.
Ro Basic scenarios,
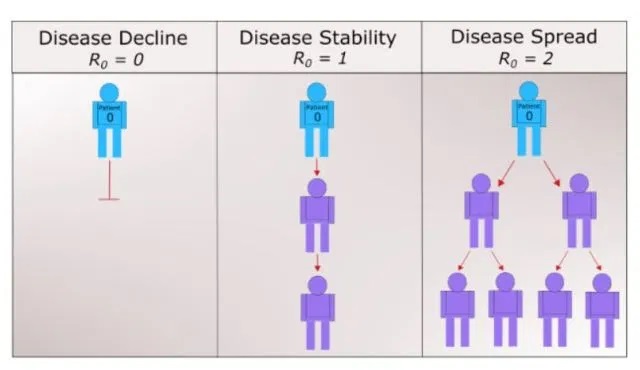
Figure 2: R0 base case (source: Triplebyte.com)
Closing schools, gyms, etc., reduces social interaction and thus reduces R0. Medical systems are limited, so it is extremely important to reduce this parameter to less than 1. If R0, >, 1, then the disease spreads; Only when R0 < 1 can the disease disappear. Therefore, in order to reduce R0, we can reasonably expect the government to adopt stricter policies to limit people's mobility.
It is important to note that R0 measures the potential route of the disease, not its speed. By influenza virus's universality, its R0 is only 1.3. High R0 is a cause for concern, not panic.
R0 is the average, so it may be affected by factors such as super spreader events. A superspreader is someone who infects many people with an infected person. During the SARS and MERS epidemics, as well as during the current covid-19 pandemic, there have been a number of incidents involving superspitters. Such events are not necessarily a bad omen, as they may indicate a continued decline in the number of people in the epidemic. And super-spenders may be easier to master and stop because their symptoms can be quite severe.
In short, R0 is a parameter that is constantly changing. Tracking every confirmed case and the spread of the disease is extremely difficult, so R0 estimation is complex and challenging. Their estimates often change as new data emerge.
So, which technical solutions can slow or stop the spread of covid-19 and effectively control R0? Of course, the latest AI technology, combined with data from mobile phone GPS movements, can be used to create analytical models to predict which communities are more likely to have future infections or which need urgent disinfection and other actions.
Big data, AI and sensors
In the case of infectious diseases, clinical data may vary considerably in quality and consistency, even including the presence of false-positive patients. Big data and AI can be used to check if isolation requirements are met, while machine learning can be used for drug research. These are the solutions developed by new digital technologies to alleviate coronavirus emergencies, such as in many Asian countries, and to successfully implement various epidemic preparedness measures using digital technologies.
Drones equipped with smart scanners and camera systems could be used to detect people who do not comply with quarantine measures. They could also measure their temperature. For example, China and Taiwan use smart cameras to intercept people who are not wearing masks and perform instant heat sensing to detect fever.
For example, SenseTime, a Chinese AI company, has developed a platform that can scan faces even while wearing a mask, while Alibaba has developed an ai-based novel coronavirus diagnostic system. SenseTime's contactless temperature detection software has been implemented in subway stations, schools and public centers in Beijing, Shanghai and shenzhen. Meanwhile, alibaba developed an ai-based covid-19 diagnostic system that USES computed tomography (CT) scans to detect infection with novel coronavirus, with an accuracy of 96%.
Virus get evolution, graph. Ai
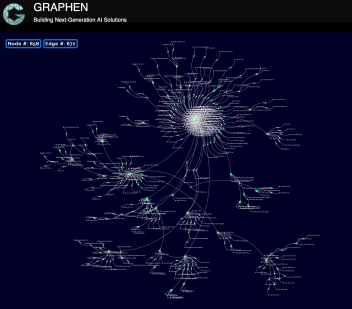
Figure 3: virus evolution (source: graphen.ai)
Graphen, in collaboration with Columbia University in the us, tried to define a typical form of sequencing each virus gene and identify its variants. It USES the Ardi AI platform, which simulates the functions of the human brain, to store data on these variations and visualize them. In figure 3, each red dot represents a virus and the green dot represents a group of viruses with the same genome sequence. Click on the red dot to see information about the virus, including location, gender and age.
Big data is another effective tool to control the epidemic. During emergencies, it has been widely used to improve surveillance systems to map the spread of the virus.
The capture and processing of big data requires the design of new methods and techniques for collection and analysis. For example, the following four big data analysis types or methods:
Descriptive analysis: what happened? Describe the present and past situation of the business process or plan, and present the performance indicators of the activities in a comprehensive and visual manner;
Predictive analysis: what will happen? Data analysis tools that use mathematical techniques such as regression analysis and prediction models to help understand possible future events;
Normative analysis: what needs to be done? To identify effective strategies and operational solutions;
Automated analysis: a tool that automates the required actions and actions based on the results of performing the analysis.
Alibaba has also developed the Alipay Health Code App, which USES big data from China's healthcare system to indicate who can or is restricted to access to public Spaces.
Toronto startup BlueDot is using an ai-built platform to develop intelligent systems that automatically monitor and predict the spread of infectious diseases. During the SARS epidemic, the BlueDot platform has achieved tangible results. In December 2019, BlueDot warned about the severity of the coronavirus symptoms and has now confirmed their accuracy. Among the tools used by BlueDot are some that use natural language processing (NLP) technology to process people's language and how they express it.
Us biotechnology company Insilico Medicine is also committed to preventing disease with AI. The company is developing next-generation AI and deep learning approaches and applying them to every step of the drug discovery and development process. New technology currently being developed by Insilico Medicine will be used in the future to advise physicians on how to combat coronavirus molecules. After recent molecular analysis, Insilico Medicine's system is able to provide feedback on how to effectively fight coronavirus. The startup is developing a database of information for vaccine development projects.
The WeBank researchers used satellite analysis to identify hot spots in steel mills, providing important information for the industry's recovery.
In the early days of the epidemic, the analysis showed that steel production had fallen to a minimum production level of 29 percent. By February 9th it had recovered to 76%. The researchers then focused on other types of production and business activities using AI, one of which was used to simply count the number of cars in large corporate parking lots. As of February 10, production of Tesla cars in Shanghai had fully resumed, while tourist attractions such as Shanghai Disneyland remained closed, according to the analysis.
Satellite image
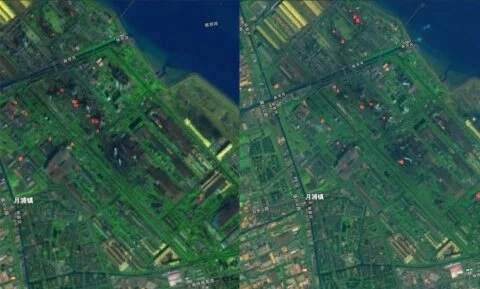
Figure 4: side-by-side satellite imagery comparing 30 December 2019 (left) and 29 January 2020 shows China's steel industry activity still at low water levels (source: spectrum.eee.org)
GPS satellite data can also be analysed to determine who is commuting. The software can be used to calculate the number of commuters in each city and compare the number of commuters in 2019 with the same date in 2020. In both 2019 and 2020, the number of commuters during the Chinese lunar New Year period dropped significantly, but the number of commuters did not recover after the 2020 holiday compared to 2019. With the outbreak under control, the WeBank researchers also calculated that about 75% of employees in China had returned to work as of March 10. Based on these curve predictions, the researchers conclude that most Chinese workers, with the exception of wuhan, will return to normal work by the end of march. The researchers also expect the economy to grow 36 percent in the first quarter of this year.
Now, scientists and researchers around the world are also trying to overcome the challenge of COVID 19, backed up by new technologies. The technologies and solutions that successfully passed the test of this emergency are expected to become the industry standard in the future.